

June 03, 2026
From Space to Soil: Building Environmental Intelligence for Agriculture
Satellite observation, field instruments, forecasts and calibrated analytics can turn fragmented farm data into block-level environmental intelligence for practical decisions.
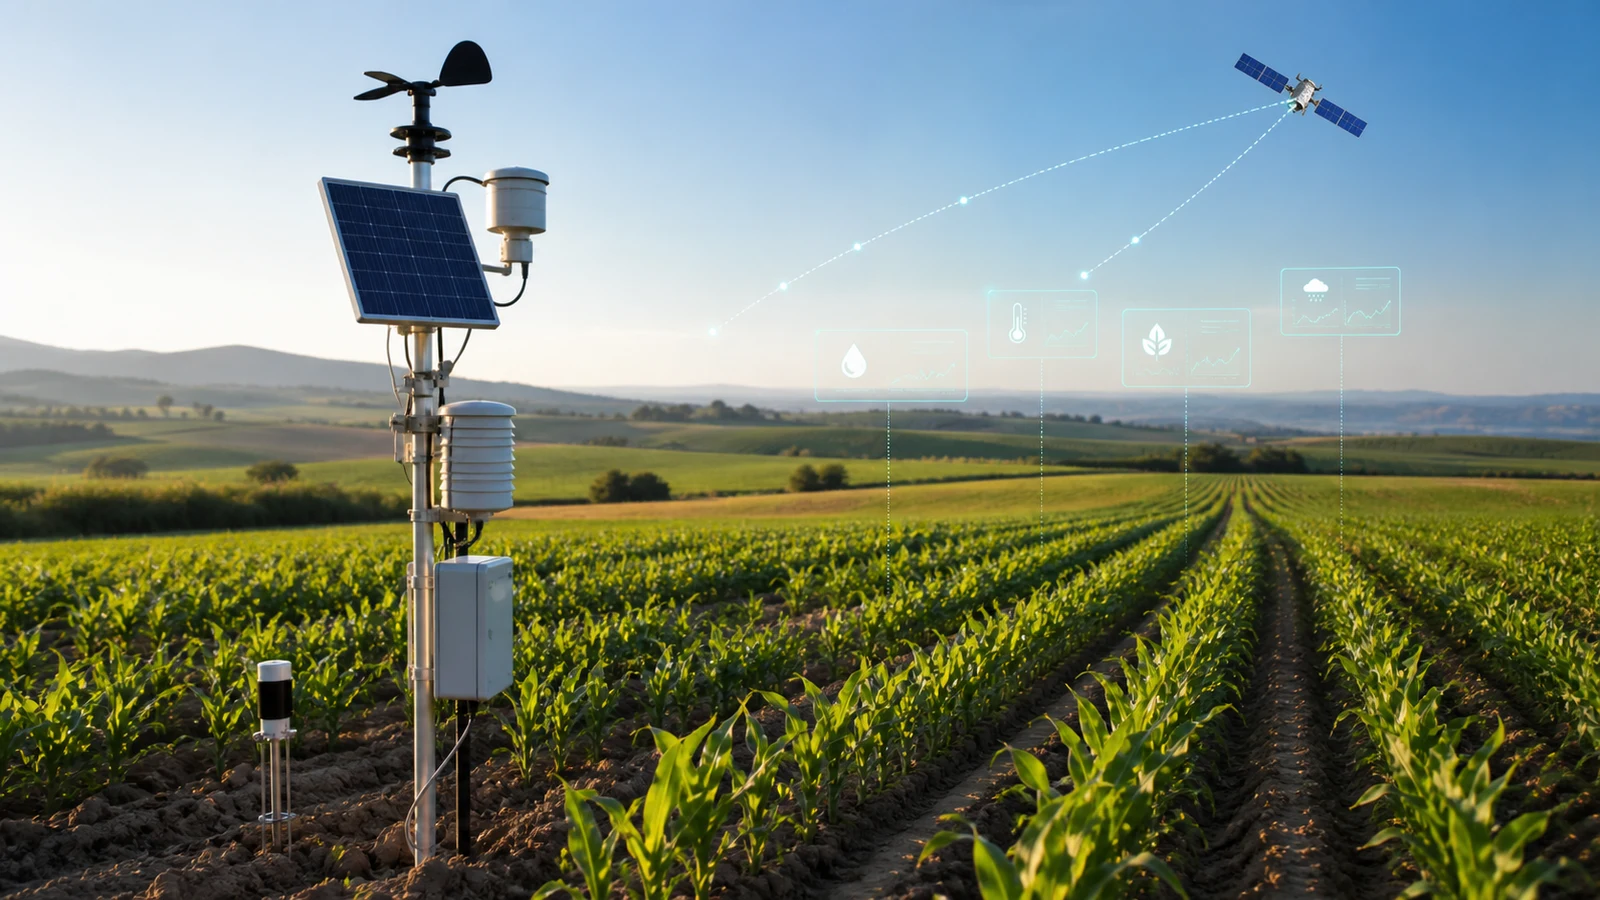
Farmers have always read their land through accumulated observation: the feel of a soil profile, the direction of a wind, the colour of a canopy and the timing of seasonal change. That knowledge remains indispensable, but climate variability, water constraints and rising input costs make it harder to act from observation alone. Environmental intelligence combines the reach of satellite data with local measurements and agronomic context so that teams can see variation across a farm, test what a model suggests and decide where attention will have the greatest value.
A farm is a changing environmental system
Temperature, humidity, rainfall, radiation, wind, soil water and crop physiology operate together. A hot afternoon does not affect every block equally: soil depth, slope, canopy cover, irrigation history and rooting pattern all change the response. Atmospheric demand may increase water loss even where a single moisture probe still looks adequate. The useful question is therefore not merely what one sensor reads, but how the connected system is behaving.
Many agricultural datasets are collected in separate tools. A station describes one point, probes describe a few depths, a satellite shows spatial patterns and a forecast describes likely future conditions. Each is valuable, but each has a different scale and purpose. Nvirosense™ environmental intelligence brings them into a common operational view, preserving source, time and location so a grower or researcher can compare like with like.
Spatial variation becomes operationally expensive when it remains hidden. A uniform irrigation instruction may overwater a heavier soil while a shallow or exposed zone continues to deplete. Field scouting may reach the visibly stressed block only after the best intervention window has narrowed. By associating observations with management zones and crop stages, teams can direct inspection and water where evidence shows the greatest need, then record whether the chosen action changed the subsequent trend.
See spatial patterns from above
Multispectral imagery can reveal where vegetation response differs across a field. Indices derived from Sentinel-2 data, including NDVI, EVI, NDRE, NDWI, MSI and MSAVI2, offer different views of vigour, chlorophyll response, moisture and stress. Sentinel-1 radar can contribute observations through cloud and can add information about surface characteristics. These layers help identify zones worth investigating; they do not diagnose a crop on their own.
Wider datasets add further context. Satellite-derived evapotranspiration, SMAP soil-moisture products, SoilGrids properties and NASA POWER weather variables can support regional comparison and fill gaps where local coverage is sparse. Resolution, revisit time and processing method matter, so the platform retains provenance and aligns each layer with field boundaries and acquisition dates. A map becomes decision support only when the user can understand what the layer represents and when it was observed.
Time series are more informative than a single colourful scene. Repeated imagery can show whether a weak zone is persistent, expanding or recovering after an intervention. Cloud, mixed pixels, bare soil and differences in growth stage can alter the signal, which is why analysts compare several dates and indices rather than reading one layer as a verdict. Field photographs, scouting notes and harvest records add another check and preserve the human observations needed to explain the pattern.
Ground truth turns coverage into confidence
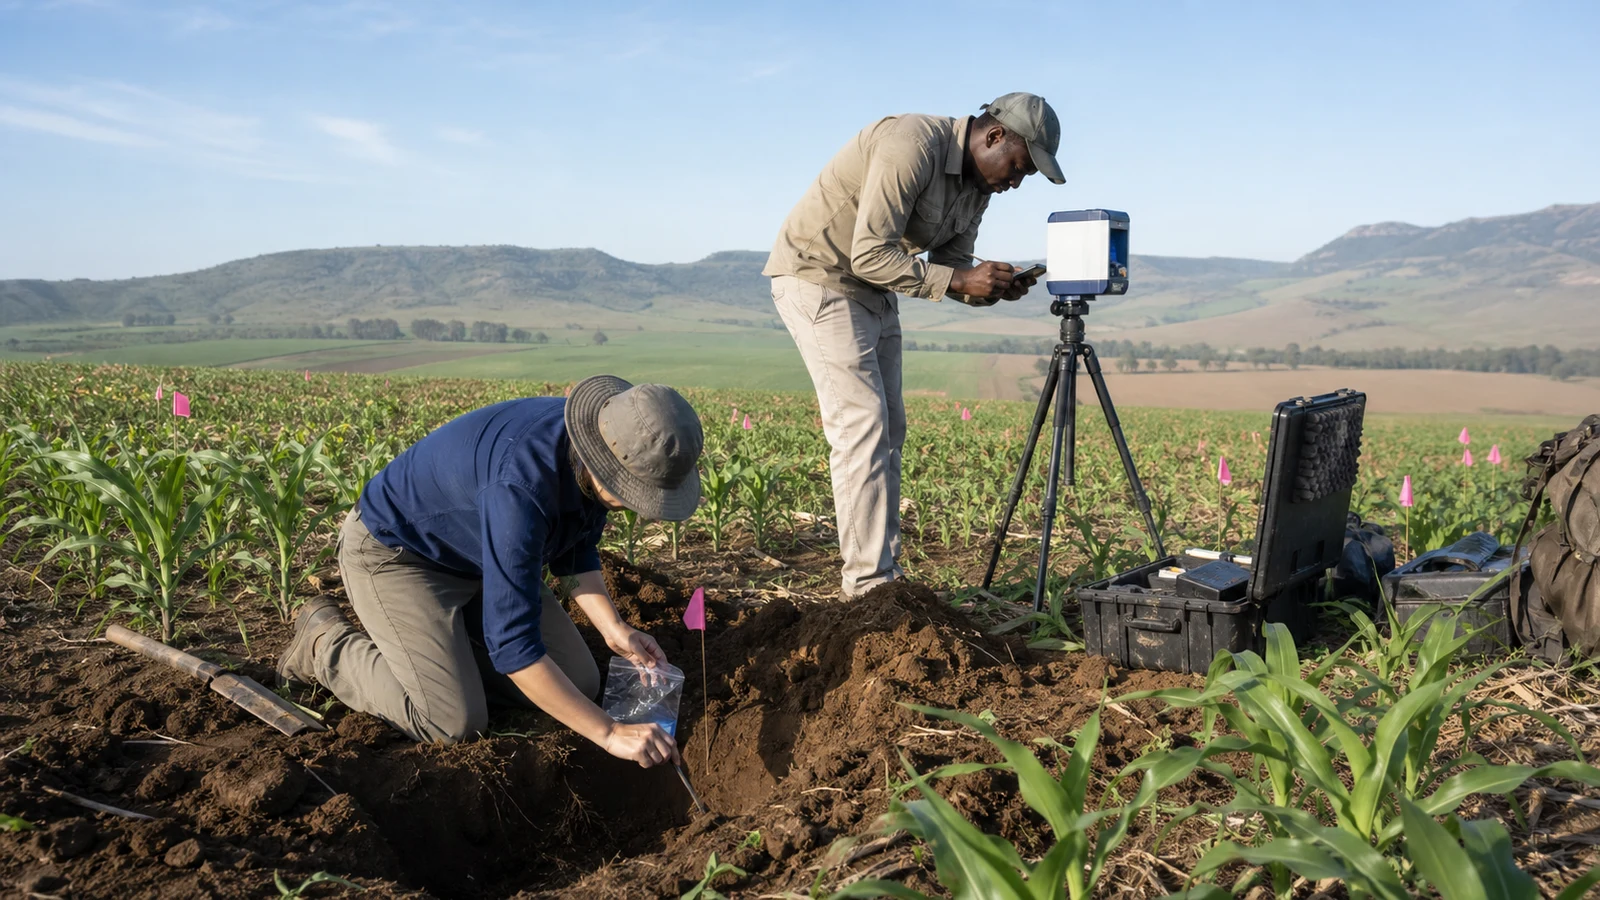
Field instruments provide the measured reference needed to interpret remote signals. Weather stations, soil-moisture and soil-temperature probes, photosynthetically active radiation sensors and edge telemetry show what happened at known points. Research networks may also include LI-COR evapotranspiration, carbon-flux or trace-gas systems. Their measurements allow analysts to check whether a satellite pattern or model output corresponds with actual crop and atmospheric behaviour.
Placement and care are as important as instrument capability. A probe installed outside the active root zone or a weather station affected by nearby structures can create a precise but unrepresentative record. Site metadata, calibration history, maintenance events and data-quality flags help reviewers judge fitness for a particular analysis. Nvirosense™ keeps these records traceable so a derived recommendation can be followed back to the observations that informed it.
Model environmental physics, not weather alone
Agricultural demand emerges from relationships between variables. Vapour pressure deficit indicates how strongly the atmosphere is drawing moisture from leaves and exposed surfaces. Evapotranspiration represents water transferred from soil and vegetation to the atmosphere. Radiation provides energy for photosynthesis and evaporation, while wind changes the exchange at the crop surface. Together these factors help explain why the same soil-water reading can produce a different plant response on two days.
Below ground, moisture at one depth cannot describe the entire profile. Surface wetness, root-zone availability, drainage, soil temperature and irrigation pulses each answer different questions. By viewing these measurements as a time series rather than isolated values, teams can see recharge, depletion and lag. The result is a more useful account of how much water is present, how quickly it is being used and which block is approaching a management threshold.
Extend measurement with calibrated virtual sensors
Physical sensors cannot economically cover every hectare at every depth. Calibrated machine-learning models can extend a well-designed ground network by learning relationships between field measurements, remote-sensing features, terrain, atmosphere and forecasts. A virtual sensor is therefore an estimate anchored to measured examples, not a replacement for instrumentation. Its output should carry the model version, spatial unit, time horizon and a confidence indicator appropriate to the available evidence.
This approach supports virtual weather or soil observations between installed points, provided performance is checked across seasons and management zones. Drift, crop-stage changes and missing telemetry can reduce model quality, so periodic comparison with fresh ground measurements is essential. Nvirosense™ analytics can highlight where a model agrees with observations, where it needs review and where another physical measurement would add the most information.
Turn the field into a decision-support twin
An agricultural digital twin is useful when it reflects a field's evolving state rather than presenting a decorative map. It can combine crop condition, soil-water status, atmospheric demand, forecast risk and management events at block level. Operators can then compare zones, inspect why one block is flagged and record the irrigation or field action that followed. This traceability is important: a recommendation should remain connected to its inputs and to the decision eventually taken.
Consider a heatwave forecast two to three days ahead. Rising temperature and vapour pressure deficit indicate increasing atmospheric demand. Satellite imagery shows a weaker canopy response in one zone, soil records show faster depletion there, and ground measurements confirm evapotranspiration is increasing. Together, those signals can prioritise an inspection or irrigation review before stress is plainly visible. They do not prescribe an automatic action; water availability, crop stage, system capacity and the grower's judgement still shape the response.
Forecast enrichment should also remain accountable. A prediction can change as newer weather runs arrive, and a block alert may depend on assumptions about rooting depth or irrigation efficiency. Retaining the forecast issue time, model inputs and later observed outcome allows the team to evaluate performance instead of remembering only successful alerts. Over successive seasons, that feedback can improve block profiles, reveal where additional sensors are justified and clarify which lead times are genuinely useful for operations.
Connect research rigour with farm operations
The same architecture can serve experimental and commercial needs. Researchers can use traceable time series for carbon exchange, irrigation science, remote-sensing validation, crop modelling and adaptation studies. Production teams can use the resulting methods for water allocation, heat response, field scouting and resilience planning. Research discipline improves operational interpretation, while long-running farm deployments create the seasonal evidence needed to test models properly.
Agriculture is also a practical starting point for wider environmental intelligence because it sits where atmosphere, soil, water, carbon, energy and food meet. Methods proven on farms can inform land restoration, catchment observation and ecosystem monitoring, with different domain controls and expert input. Nvirosense™ focuses on the infrastructure that makes this possible: trustworthy sensing, consistent spatial records, transparent analytics and tools that turn evidence into a reviewable decision.
Partnerships are important because no single deployment contains every climate, soil and crop combination. Research groups contribute experimental design and reference measurements; growers contribute management knowledge and realistic operating constraints; technology teams contribute data engineering and maintainable field infrastructure. Pilot sites should therefore define the question, success measures, access rules and review period before instruments are installed. A well-scoped collaboration produces reusable evidence, while an open-ended technology trial can generate data without resolving the decision it was meant to support.
No single satellite, probe, forecast or algorithm can represent a farm. The stronger model is a measured and continuously checked combination of all four, organised around the blocks and decisions that matter. By joining space-based coverage to soil-level evidence, Nvirosense™ helps agricultural and research teams detect patterns sooner, examine their causes and build an environmental record that improves with every season.